Note
Go to the end to download the full example code.
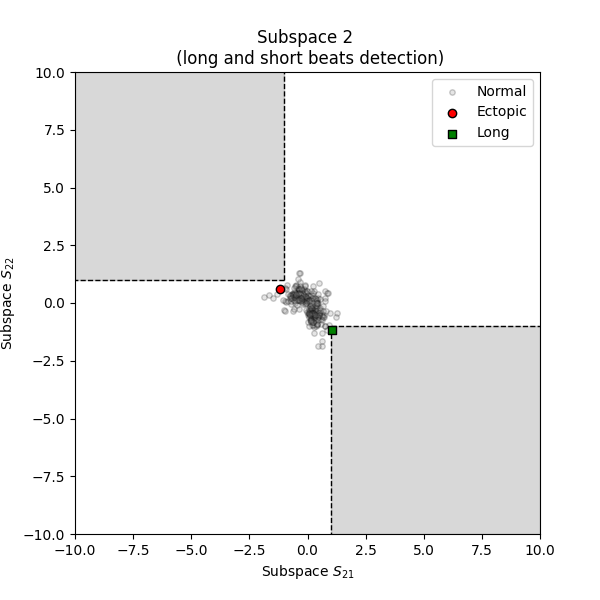
Plot short and long invertvals#
Visualization of short, long, extra and missed intervals detection.
The artefact detection is based on the method described in [1].
# Author: Nicolas Legrand <nicolas.legrand@cas.au.dk>
# Licence: GPL v3
Visualizing short/long and missed/extra intervals from a RR time series#

<Axes: title={'center': 'Subspace 2 \n (long and short beats detection)'}, xlabel='Subspace $S_{21}$', ylabel='Subspace $S_{22}$'>
Visualizing ectopic subspace from the artefact dictionary#
from systole.detection import rr_artefacts

# Use the rr_artefacts function to short/long and extra/missed intervals
artefacts = rr_artefacts(rr)

plot_shortlong(artefacts=artefacts)
<Axes: title={'center': 'Subspace 2 \n (long and short beats detection)'}, xlabel='Subspace $S_{21}$', ylabel='Subspace $S_{22}$'>
Using Bokeh as plotting backend#
from bokeh.io import output_notebook
from bokeh.plotting import show
from systole.detection import rr_artefacts

output_notebook()

show(plot_shortlong(artefacts=artefacts, backend="bokeh"))
Total running time of the script: (0 minutes 0.329 seconds)