Note
Go to the end to download the full example code.
Plot ectopic beats#
# Author: Nicolas Legrand <nicolas.legrand@cas.au.dk>
# Licence: GPL v3

from systole.plots import plot_ectopic
Visualizing ectopic subspace from RR time series#
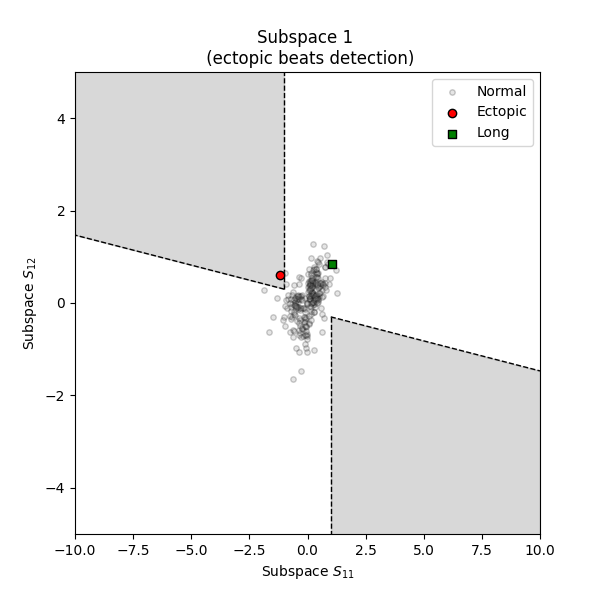
<Axes: title={'center': 'Subspace 1 \n (ectopic beats detection)'}, xlabel='Subspace $S_{11}$', ylabel='Subspace $S_{12}$'>
Visualizing ectopic subspace from the artefact dictionary generated by systole.detection.rr_artefacts()#
from systole.detection import rr_artefacts

# Use the rr_artefacts function to find ectopic beats
artefacts = rr_artefacts(rr)

plot_ectopic(artefacts=artefacts)

<Axes: title={'center': 'Subspace 1 \n (ectopic beats detection)'}, xlabel='Subspace $S_{11}$', ylabel='Subspace $S_{12}$'>
Using Bokeh as plotting backend#
from bokeh.io import output_notebook
from bokeh.plotting import show
from systole.detection import rr_artefacts

output_notebook()

# Use the rr_artefacts function to find ectopic beats
artefacts = rr_artefacts(rr)
show(plot_ectopic(artefacts=artefacts, backend="bokeh"))
Total running time of the script: (0 minutes 0.333 seconds)